Thank you for reading. Please subscribe and support Ayanomics 9 Trends so this work can continue.

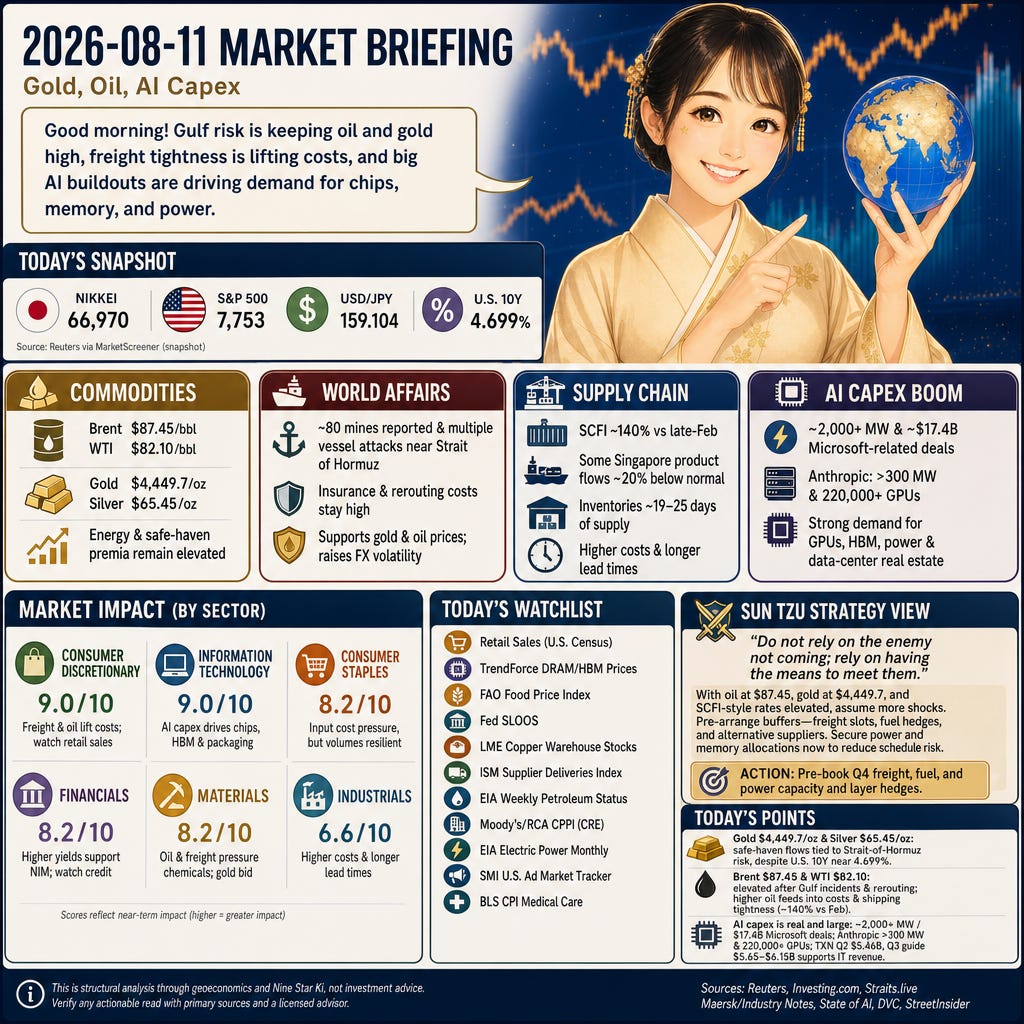
Good morning. Today’s tape is defined by elevated energy and safe‑haven pricing, tight freight lanes, and outsized AI capex. Brent at $87.45 and gold at $4,449.7 reflect Gulf risk feeding into costs and rates. SCFI‑style spot freight tightness raises landed costs and lead times. Meanwhile, multi‑GW AI buildouts continue to pull on chips, memory, power, and data‑center real estate.
Paywall
Stocks and FX
Nikkei 66,970, USD/JPY 159.104, S&P 500 7,753, and U.S. 10Y 4.699% frame the cross‑asset backdrop (Reuters via MarketScreener; snapshot). Reuters linked prior yen swings toward ~161.44 to pension‑allocation talk, alongside foreign inflows to Japan. The combination of a firm dollar and higher U.S. yields encourages portfolio rebalancing into Japan and raises FX‑hedging costs for exporters. Higher long rates compress growth‑stock valuations at the margin while supporting bank NIM via rising asset yields.
Commodities
Brent $87.45/bbl and WTI $82.10/bbl, with gold $4,449.7/oz and silver $65.45/oz, show a persistent risk premium and safe‑haven bid (Reuters via Investing.com; snapshot). Higher crude lifts transport, packaging, and petrochemical feedstock costs, pressuring Consumer Discretionary and Industrials margins and filtering into headline inflation. The gold/silver surge signals risk aversion that can tighten financial conditions via stronger dollar demand and rate volatility. Energy input inflation also feeds back into freight and bunker costs, reinforcing shipping tightness.
World Affairs
Roughly 80 mines reported in chronologies and multiple vessel attacks around the Strait of Hormuz keep a security premium embedded in Brent $87.45 (Straits.live compilation; UKMTO/Reuters entries). Elevated route risk lifts insurance and rerouting costs, lengthening voyages and reducing effective capacity. The same shock supports safe‑haven flows into gold ($4,449.7/oz) and can shake FX as investors seek dollar and JPY liquidity. Energy, Materials, and Transportation see the most direct transmission via higher input and financing costs.
Supply Chain
SCFI (Shanghai Containerized Freight Index) was cited ~140% above late‑February levels in industry notes, while some Singapore product flows ran ~20% below normal and regional inventories at ~19–25 days of supply (Maersk/industry commentary roundups). Higher spot rates and diversions raise landed costs and extend lead times for retailers and manufacturers. Tighter container and tanker availability also increases bunker demand, reinforcing crude benchmarks. Inventory planning must account for longer cash conversion cycles and potential peak‑season surcharges.
AI
2,000+ MW and ~$17.4B in reported Microsoft‑related capacity commitments, plus Anthropic’s >300 MW bursts and 220,000+ GPUs, define near‑term AI infrastructure pull (State of AI, DVC). These orders sustain demand for GPUs, HBM memory, and advanced packaging, while straining power and interconnection capacity for new data centers. The buildout supports semiconductors and select platforms, but tight HBM/packaging supply can lift input costs and stagger deployments. Utilities and Real Estate feel rising grid and site pressures as projects move from MoUs to firm schedules.
Industry News
$5.46B Q2 revenue and a Q3 guide of $5.65–$6.15B from Texas Instruments (Reuters via StreetInsider) show AI capex and recovering industrial/auto demand converting into orders. The beat and guidance midpoint (~$5.90B) confirm analog and power‑management demand linked to data‑center and automation spend. This provides earnings support across the semiconductor ecosystem and parts of Industrials, partly offsetting freight and energy headwinds. Monitor whether similar cadence appears in peers to validate a broader upcycle.
Industry Forecast
Today’s Setup
2026-08-11 is a One White Water (Ippaku Suisei, 一白水星) day under a Two Black Earth (Jikoku Dosei, 二黒土星) month in a One White Water year, during Risshuu (Beginning of Autumn). Expect networks and flows—FX, shipping lanes, and data capacity—to drive outcomes, while inventory carry and funding costs (10Y 4.699%) set the medium‑term tone. Elevated oil and spot freight tighten margins; AI buildouts keep chips, memory, and power in high demand.
Focus Sectors
Consumer Discretionary (9.0/10): SCFI‑style spot rates cited ~140% above February and Brent at $87.45/bbl push inbound and last‑mile costs higher. Diversified merchants with flexible routing and omnichannel checkout can hold conversion and pricing, blunting margin compression. FX volatility (USD/JPY 159.104) adds translation and hedging noise for travel and exporters. Watch the U.S. Census control‑group retail sales for demand resilience as costs rise and promotion calendars flex into peak season.
Information Technology (9.0/10): AI capex remains the binding node: 2,000+ MW/$17.4B‑class power deals and Anthropic’s >300 MW and 220,000+ GPUs sustain demand. That flows into GPUs, HBM (high‑bandwidth memory), and CoWoS (chip‑on‑wafer‑on‑substrate) packaging, while TXN’s $5.46B Q2 and $5.65–$6.15B Q3 guide show orders landing. Bottlenecks in HBM/packaging and power interconnections can pace shipments and revenue recognition. Monitor TrendForce’s DRAM/HBM pricing for tightness and any sequential easing that would broaden unit availability.
Consumer Staples (8.2/10): Brent $87.45 and Hormuz‑related risk lift packaging, fertilizer, and transport costs, but route density and shelf necessity support volumes and pass‑through. Retailers can defend margins via inventory discipline and private‑label mix while smoothing promotions if freight spikes persist. Watch the FAO Food Price Index for input inflation and monitor port turn times as lead‑time noise rises into peak season. Localized out‑of‑stocks and working‑capital swell are the near‑term risks if rerouting intensifies.
Financials (8.2/10): U.S. 10Y at 4.699% and 30Y at 5.243% lift asset yields and can widen NIM (net interest margin: loan yield minus funding cost), while cross‑border flows tied to Japan (Nikkei 66,970; USD/JPY 159.104) support brokerage and trading. Rate volatility, however, pressures securities books (AOCI) and funding stability. Credit normalization would add provisions. Track the Fed’s SLOOS for lending‑standards direction and loan demand; a softening print would flag slower fee growth and rising credit risk into 2026 maturities.
Materials (8.2/10): Feedstock costs price off Brent $87.45 while Gulf security keeps a freight/insurance premium in petrochemicals; safe‑haven flows into gold at $4,449.7/oz support some miners. Chemicals and packaging face tighter spreads if oil and shipping costs stay high, and diversions can delay offtake and tie up working capital. For metals, copper demand is underpinned by grid and data‑center buildouts. Watch LME Copper warehouse stocks for physical tightness and be alert to a sharp gold or copper pullback that could whipsaw cash flows.
Industrials (6.6/10): SCFI‑derived spot container rates ~140% above February alongside Brent at $87.45 raise working capital and compress operating leverage as inputs climb. Order conversion is gated by supplier delivery times and port reliability; rerouting extends cycle times and complicates backlog burn. Offsets exist where factory automation and electronics content rise with AI‑related investment, echoing TXN’s stronger guide. Monitor ISM Supplier Deliveries for lead‑time direction and bunker/charter rates for margin risk on fixed‑price projects.
Watchlist
Consumer Discretionary: U.S. Census Bureau Advance Monthly Retail Trade Survey (monthly control‑group retail sales that best map to GDP consumption).
Information Technology: TrendForce DRAM/HBM contract price tracker (monthly memory pricing and supply tightness from TrendForce).
Consumer Staples: FAO Food Price Index (monthly global food‑commodity price levels from the UN Food and Agriculture Organization).
Financials: Federal Reserve SLOOS (Senior Loan Officer Opinion Survey on Bank Lending Practices — quarterly lending standards and loan‑demand signals).
Materials: LME Copper warehouse stocks (daily London Metal Exchange inventories indicating physical market tightness).
Industrials: ISM Manufacturing Supplier Deliveries Index (monthly diffusion index of delivery speed from the Institute for Supply Management).
Energy: EIA Weekly Petroleum Status Report (weekly U.S. crude stocks, refined‑product inventories, and refinery utilization from the Energy Information Administration).
Real Estate: Moody’s/RCA CPPI (Real Capital Analytics Commercial Property Price Index — monthly U.S. CRE pricing and trend data).
Utilities: EIA Electric Power Monthly (U.S. electricity generation mix, retail sales, and average retail prices from the Energy Information Administration).
Communication Services: Standard Media Index (SMI) U.S. Ad Market Tracker (monthly agency and marketer ad‑spend).
Health Care: BLS CPI Medical Care index (monthly price changes for medical care services and commodities from the Bureau of Labor Statistics).
Caveats
Risshuu began on 2026-08-07, so a mid‑window seasonal shift can change demand cadence and cost sensitivity over the next week. A rapid Gulf de‑escalation or a sharp move in U.S. yields/FX would unwind oil and safe‑haven premia; AI capex timelines and SCFI readings are compiled from varying sources and may be revised.
Sun Tzu Strategy View
Sun Tzu wrote: —— Do not rely on the enemy not coming; rely on having the means to meet them.
With oil at $87.45, gold at $4,449.7, and SCFI‑style rates elevated, the prudent stance is to assume further shocks and pre‑arrange buffers: freight slots, fuel hedges, and alternative suppliers. AI buildouts are real but gated by power and packaging, so securing interconnection queues and memory allocations now reduces schedule risk if supply tightens again.
Action: Pre‑book Q4 freight, fuel, and power capacity and layer hedges where balance‑sheet tolerances allow.
Today’s Points
Gold reached $4,449.7/oz (snapshot) with silver at $65.45/oz — safe‑haven flows are tied to Strait-of-Hormuz maritime risk (chronologies report mine-clearance and vessel attacks) even as U.S. 10Y yields are near 4.699%.
Brent $87.45/bbl and WTI $82.10/bbl remain elevated after reported Gulf incidents and rerouting pressure; higher oil is feeding into Industrials and Consumer Discretionary input costs and shipping tightness (SCFI commentary ~140% vs Feb).
AI capex is real and large: reported commitments include ~2,000+ MW / $17.4B class Microsoft infrastructure deals and Anthropic-framed >300 MW with 220,000+ GPUs, supporting IT sector revenue (TXN Q2 $5.46B; Q3 guide $5.65–$6.15B).
This is structural analysis through geoeconomics and Nine Star Ki, not investment advice. Verify any actionable read with primary sources and a licensed advisor.