

Thank you for reading. Please subscribe and support Ayanomics 9 Trends so this work can continue.

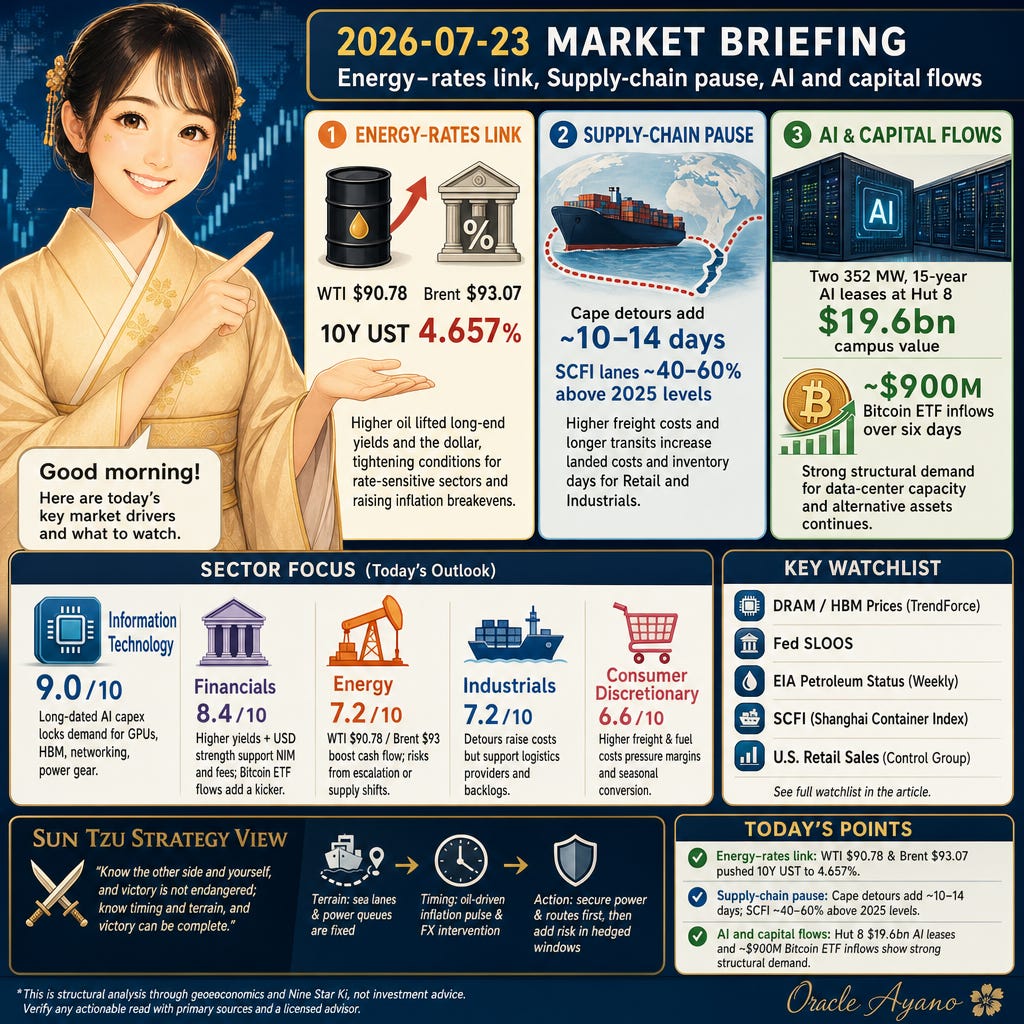
Good morning. WTI at $90.78 and Brent near $93 have pushed long-end U.S. yields to 4.657% (10Y) and lifted the dollar as USD/JPY hovers around 163.5. Carriers’ Cape detours are adding ~10–14 days to voyages and keeping container rates elevated. At the same time, GW‑scale AI data‑center leases and fresh Bitcoin ETF inflows signal persistent structural demand despite the macro noise.
Paywall
Stocks and FX
10Y UST at 4.657% and 30Y at 5.147% coincided with a firmer dollar and USD/JPY around 163.499 as Tokyo reiterated it is ready to act (Metrobank Wealth Insights reporting Reuters). Equities were mixed with the S&P 500 at 7,499 and the Nasdaq at 25,691 on a tape balancing higher oil and earnings positioning. A stronger dollar and higher yields tighten conditions for rate‑sensitive sectors and compress FX translations for exporters while boosting dealer FX flow and hedging revenue.
Commodities
WTI jumped 4.55% to $90.78/bbl and Brent traded near $93.07/bbl, extending a multi‑day rally (The Business Times citing Reuters). The move, tied to renewed U.S.–Iran strikes and Red Sea threats, raises fuel, freight, and petrochemical input costs and feeds headline inflation expectations. That combination threatens margins for transport‑heavy firms while reinforcing upstream cash flow and crack‑spread sensitivity across the Energy complex.
World Affairs
U.S. forces carried out strikes on Iran for an 11th–12th consecutive night, with blasts reported across multiple provinces; U.S. officials are also probing possible Russian assistance to Iranian attacks (Investing.com republishing a Reuters exclusive). Escalation risk supports WTI $90.78/Brent $93.07 and keeps Gulf shipping disruption in play, transmitting into higher freight insurance and sustained risk premia in rates and FX.
Supply Chain
Rerouting via the Cape of Good Hope is adding ~10–14 days to Asia–Europe transits and keeping container rates elevated, with SCFI lanes ~40–60% above 2025 levels; the Baltic Dry Index printed ~2,670–2,752 in mid‑July (Maersk and C.H. Robinson updates). Longer transits raise inventory days and landed costs, pressuring lean‑inventory retailers and transport‑exposed Industrials while favoring logistics capacity providers.
AI
Two 15‑year, 352 MW leases at Hut 8 lifted its Beacon Point campus base‑term value to $19.6bn, fully commercializing the site (company press release/PR Newswire). Multi‑hundred‑MW tranches lock multi‑year demand for GPUs, HBM memory, networking, and power systems, anchoring semiconductor and interconnect backlogs. The scale also underpins data‑center REIT rents and utility capex tied to interconnections and transformers.
Industry News
Spot Bitcoin ETFs recorded roughly $900M of net inflows across six sessions, including about $203M in a single day, as BTC traded near $65,555 (Holder.io). Concentrated ETF flows can lift trading fees and custody revenue in Financials and shift marginal risk appetite that bleeds into tech multiples and funding conditions.
Industry Forecast
Today’s Setup
On 2026-07-23, a Two Black Earth (Jikoku Dosei, 二黒土星) day under a Three Blue Wood (Sanpeki Mokusei, 三碧木星) month and a One White Water (Ippaku Suisei, 一白水星) year favors build‑and‑defend execution: finish funded projects, manage cash cycles, and avoid speculative pivots during Shosho (Lesser Heat). With WTI near $90–93 and the 10Y UST at 4.657%, the operative channels are financing costs and logistics — focus on freight surcharges, power availability, and working‑capital turns.
Focus Sectors
Information Technology (9.0/10): Two 15‑year, 352 MW Hut 8 leases ($19.6bn base‑term campus value) lock multi‑year demand for GPUs, HBM, networking, and power gear, supporting semiconductor and OEM backlogs despite higher discount rates. The driver is long‑dated data‑center capex that converts into supplier lead orders, not short‑cycle devices. Watch power‑delivery and interconnection bottlenecks, advanced packaging (CoWoS) and HBM capacity, and any shift in export‑control regimes; track TrendForce DRAM/HBM pricing for demand signals.
Financials (8.4/10): A 10Y UST at 4.657% and 30Y at 5.147% can widen net interest margins if asset yields outpace deposit betas, while USD/JPY ~163.5 lifts hedging and client‑flow revenue. ~$900M in six‑day spot Bitcoin ETF inflows adds a fees/trading kicker. Risks are rising funding costs and MTM on securities, oil‑linked inflation lifting delinquencies, and FX intervention whipsaws. Watch the Fed’s SLOOS for lending‑standards and demand direction of travel.
Energy (7.2/10): WTI $90.78 (+4.55% d/d) and Brent ~$93 on U.S.–Iran strikes and Red Sea threats lift upstream cash generation and sustain risk premia. Product spreads (cracks) and Cape detours keep bunker demand firm, supporting refiners with balanced slates. A rapid de‑escalation, OPEC+/SPR supply, or refinery outages could compress or invert margins. Monitor EIA Weekly Petroleum Status for inventory draws, refinery runs, and product tightness.
Industrials (7.2/10): Cape‑of‑Good‑Hope detours add ~10–14 days and keep SCFI lanes ~40–60% above 2025, raising inventory days and landed costs while supporting providers of logistics capacity and resilient backlogs. Higher oil inflates fuel and freight surcharges; USD/JPY ~163.5 complicates hedges for Japan‑exposed names. Further detours or bunker spikes squeeze transport‑heavy subsectors. Watch the Shanghai Containerised Freight Index for rate relief or further tightness.
Consumer Discretionary (6.6/10): Freight delays and WTI near $91 raise shipping and gasoline costs, pressuring conversion and returns just as seasonal windows approach. Longer transits risk missing back‑to‑school and fall drops; a weak yen near 163.5/USD squeezes importers’ margins and pricing strategy. If energy keeps headline inflation firm, wallets may thin. Watch the U.S. Census Retail Sales (control group) for core spend resilience versus margin pressure.
Watchlist
Information Technology: TrendForce DRAM (incl. HBM) contract price updates (monthly benchmarks for memory pricing that proxy AI compute demand).
Financials: Federal Reserve Senior Loan Officer Opinion Survey (SLOOS) — quarterly lending standards and loan‑demand conditions across C&I and consumer credit.
Energy: EIA Weekly Petroleum Status Report (weekly U.S. crude and product inventories plus refinery utilization).
Industrials: Shanghai Containerised Freight Index (Shanghai Shipping Exchange weekly spot container‑rate benchmark).
Consumer Discretionary: U.S. Census Advance Monthly Retail Sales (control group) — monthly gauge of core discretionary spending excluding autos, gas, building materials.
Consumer Staples: BLS CPI ‘Food at home’ index (monthly grocery‑price inflation that signals shelf‑price and margin pressure).
Materials: LME Copper 3‑month price and warehouse stocks (London Metal Exchange benchmark and visible inventories as a proxy for industrial demand/tightness).
Real Estate: MBA Weekly Mortgage Applications (Purchase Index) — weekly read on U.S. housing credit demand that correlates with transaction activity and RE financing conditions.
Utilities: EIA Electric Power Monthly — U.S. electricity generation mix, retail sales, and average retail prices indicating load growth and cost recovery.
Communication Services: S&P Global U.S. Services PMI — New Orders (monthly read on services demand that correlates with ad‑budget momentum).
Health Care: BLS CPI Medical Care services index (monthly pricing of outpatient, hospital and related services as a proxy for reimbursement/pricing traction).
Caveats
A solar‑term shift later in July could rebalance emphasis from groundwork to throughput, changing how freight and power constraints show up in margins. Rapid de‑escalation in the Middle East, FX intervention around USD/JPY ~163.5, or a sharp curve move would revise today’s rate‑ and energy‑linked read.
Sun Tzu Strategy View
Sun Tzu wrote: —— Know the other side and yourself, and victory is not endangered; know timing and terrain, and victory can be complete.
Today’s terrain is fixed: sea‑lane detours, grid‑interconnection queues, and long yields near 4.657%. Timing is the oil‑driven inflation pulse and potential FX intervention. Plans that respect these constraints — sequencing capex to power access, hedging in liquid windows, and front‑loading inventory where transit adds 10–14 days — will outperform brute force.
Action: Align deployment to terrain: secure power and routes first, then add risk only within hedged windows.
Today’s Points
Energy–rates link: WTI at $90.78 and Brent at $93.07 pushed 10Y UST to 4.657%, tightening financial conditions for rate‑sensitive sectors and lifting inflation breakevens.
Supply‑chain pause: carriers’ Cape‑of‑Good‑Hope detours add ~10–14 days to transit times and SCFI lanes are ~40–60% above 2025 levels, increasing landed cost and inventory days for Consumer Discretionary and Industrials.
AI and capital flows: two 352 MW, 15‑year AI leases at Hut 8 (base‑term $9.8bn each -> $19.6bn campus value) plus ~$900M of Bitcoin ETF inflows over six days show concurrent, large-scale structural demand for data‑center capacity and alternative assets despite macro volatility.
This is structural analysis through geoeconomics and Nine Star Ki, not investment advice. Verify any actionable read with primary sources and a licensed advisor.
@whitefang137 さん、@tigercapitalresearch さん、いいねありがとうございます。読んでいただけてうれしいです