


Thank you for reading. Please subscribe and support Ayanomics 9 Trends so this work can continue.
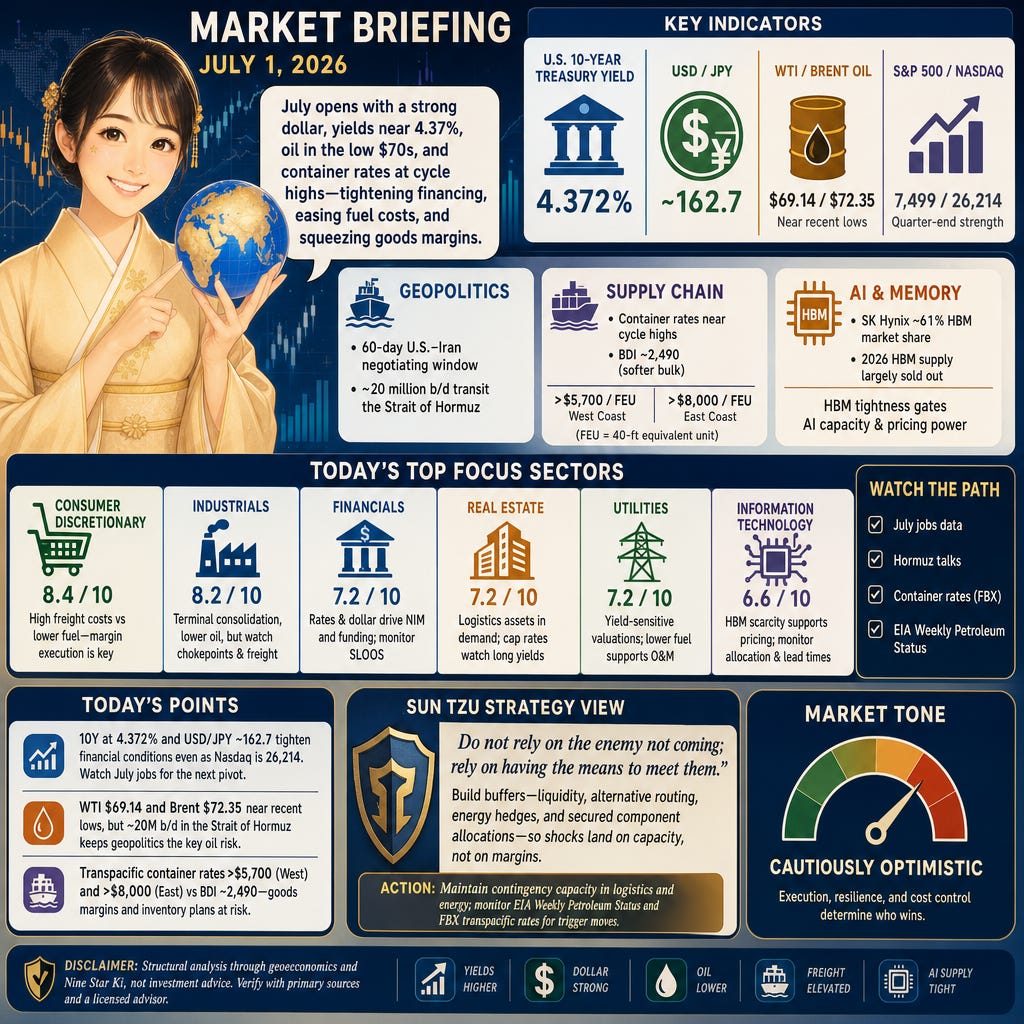
Good morning. July opens with a strong dollar and a 10-year U.S. Treasury at 4.372% alongside equity strength, oil back in the low $70s, and container rates near cycle highs. The mix tightens financing while easing energy costs and straining goods margins. AI capacity remains gated by high‑bandwidth memory, keeping hardware lead times and supplier power front and center.
Stocks and FX
USD/JPY near 162.7 and the U.S. 10‑year at 4.372% (Reuters) frame a firmer dollar as the S&P 500 prints 7,499 and the Nasdaq 26,214 into quarter‑end (Market Snapshot). A stronger dollar tightens global financial conditions and lifts dollar funding costs, while higher long yields can compress growth‑stock multiples if they advance further. Banks’ net interest margin (the spread between loans and deposits) benefits from stable-to-higher rates, but curve shifts still matter for securities books and trading risk.
Commodities
WTI $69.14 and Brent $72.35 (Reuters/Market Snapshot) sit near recent lows after Gulf tensions eased, with Reuters noting Brent’s roughly 38% quarterly drop. Cheaper crude lowers transport and packaging costs, easing headline inflation and supporting consumer and industrial margins. The flip side is pressure on upstream cash flows and narrower refining cracks if products don’t hold up, keeping Energy sector capex and balance sheets in focus.
World Affairs
A 60‑day U.S.–Iran negotiating window and ~20 million b/d transiting the Strait of Hormuz (Reuters, EIA) define oil’s risk corridor. Failure to operationalize reopenings sustains an energy risk premium and raises freight and insurance costs; credible progress would relieve barrels and shipping routes. Insurers, refiners, and bulk logistics price this path dependency directly into coverage, margins, and schedules.
Supply Chain
Paid content below this line
$5,700+/FEU to the U.S. West Coast and $8,000+/FEU to the East Coast (Freightos) with the Baltic Dry Index around 2,490 (Hellenic Shipping News) show container stress vs softer bulk. Bunker fuel down ~12% since early June helps, but spot container rates keep landed costs high and compress retail margins; FEU is a 40‑foot‑equivalent unit used to price boxes. Bulk easing flags slower restocking for miners and chemicals and gives shippers some relief on non‑container cargoes.
AI
KRW 2,080.4 trillion (~$1.35 trillion) market cap and ~61% HBM share put SK Hynix at Korea’s top slot (Reuters), with 2026 HBM supply largely sold out across industry reporting. Tight high‑bandwidth memory gating raises AI server costs and sequences data‑center capex toward suppliers with guaranteed allocation. That supports pricing power for memory and advanced packaging while making AI valuations more sensitive to rates and delivery timing.
Industry News
$1.4 billion for a 49% stake in a major terminal (Seatrade/Splash reporting) signals ongoing port consolidation as trade flows reroute. With the Dow at 52,319, S&P 7,499, and Nasdaq 26,214 (Market Snapshot), financing for infrastructure remains accessible, supporting terminal upgrades and network control. Terminal ownership shifts can alter carrier pricing power and lease terms, affecting Industrials and logistics‑linked Real Estate.
Industry Forecast
Today’s Setup
2026-07-01 is a Six White Metal (Roppaku Kinsei, 六白金星) day within a Four Green Wood (Shiroku Mokusei, 四緑木星) month and a One White Water (Ippaku Suisei, 一白水星) year, ahead of Shosho (Lesser Heat) on 2026-07-07. Expect markets to reward execution and cost control: container rates are the key cost shock, oil’s slide eases fuel lines, and a firm dollar and 10‑year yields set the financing tone.
Focus Sectors
Consumer Discretionary (8.4/10): Transpacific spot rates above ~$5,700/FEU (West) and $8,000/FEU (East) per Freightos lift landed costs just as bunker fuel is ~12% lower and oil sits near the low $70s. Retailers with clean fulfillment, checkout, and dynamic pricing can protect gross margin; travel/leisure benefits from cheaper fuel. Watch for another front‑loading wave or tariff deadlines that could force promotional cuts and inventory pulls if Freightos prints climb again.
Industrials (8.2/10): A reported $1.4bn sale of a 49% terminal stake (Seatrade/Splash) concentrates logistics control as container rates surge while the Baltic Dry Index eases to ~2,490. Lower oil reduces operating costs and supports bid discipline on projects, aiding order conversion where supplier deliveries hold. Risks are chokepoint setbacks in Hormuz that would reprice bunker and schedules, and elevated box rates straining OEM working capital; track ISM New Orders and Supplier Deliveries.
Financials (7.2/10): The 10‑year UST at 4.372% and USD/JPY ~162.7 (Reuters) shape net interest margin, FX translation, and EM funding, while S&P 7,499 and Nasdaq 26,214 (Market Snapshot) keep underwriting pipelines active. Softer oil tempers inflation expectations, potentially helping the rate path later in Q3. Key risks are a sharp rates rally or curve flattening that compresses NIM, CRE refinancing pressure if cap rates widen, and dollar strength stressing cross‑border credit; watch the Fed’s SLOOS.
Real Estate (7.2/10): Cap‑rate math references the 10‑year at 4.372% (Reuters), while a $1.4bn 49% terminal deal (Seatrade/Splash) shows capital still bids for logistics‑linked assets. Lower oil marginally eases operating costs, supporting industrial and infrastructure‑adjacent RE. Elevated container rates can pressure retailer tenants’ coverage ratios. Upside rate surprises would widen cap rates and hit values; monitor Green Street’s CPPI for private‑market trend shifts.
Utilities (7.2/10): Allowed returns are set against bond yields, so long‑rate levels and volatility remain the valuation anchor. With oil lower and inflation easing at the margin (Reuters), fuel and O&M lines are steadier, while grid and renewables capex pace drives rate‑base growth. Risks are yield spikes that pressure multiples, weather‑driven load volatility, and interconnection delays; track EIA Electric Power Monthly for mix and pricing.
Information Technology (6.6/10): HBM allocation is the gating factor: Reuters pegs SK Hynix near ~61% HBM share with 2026 supply effectively sold out, steering AI server builds and pricing. Rates and a firmer dollar raise discount‑rate sensitivity, but supply‑driven pricing power and backlog visibility support AI hardware and adjacent software. Risks are allocation shortfalls, packaging bottlenecks, and export‑control shifts; follow TrendForce’s DRAM/HBM contract price index.
Watchlist
Consumer Discretionary: Freightos Baltic Index (FBX) Asia–US West/East Coast spot rates (weekly container shipping costs on key transpacific lanes, publisher: Freightos)
Industrials: ISM Manufacturing PMI — New Orders and Supplier Deliveries (monthly U.S. factory demand and supply bottlenecks, publisher: Institute for Supply Management)
Financials: Federal Reserve SLOOS — Senior Loan Officer Opinion Survey (quarterly bank lending standards and loan demand, publisher: Federal Reserve Board)
Real Estate: Green Street Commercial Property Price Index (CPPI) (monthly private‑market CRE pricing trends, publisher: Green Street)
Utilities: EIA Electric Power Monthly (U.S. generation mix, retail sales, and retail prices, publisher: U.S. Energy Information Administration)
Information Technology: TrendForce DRAM and HBM contract price index (monthly memory contract pricing and supply trends, publisher: TrendForce)
Consumer Staples: FAO Food Price Index (monthly global food commodity prices across cereals, oils, dairy, meat, sugar, publisher: UN FAO)
Materials: Caixin China Manufacturing PMI (monthly Chinese factory activity and new orders, publisher: Caixin/S&P Global)
Health Care: FDA CDER drug approvals dashboard (monthly novel and supplemental drug approvals, publisher: U.S. Food and Drug Administration)
Communication Services: Standard Media Index (SMI) Core U.S. ad spend (monthly agency‑invoice ad expenditure by category, publisher: Standard Media Index)
Energy: EIA Weekly Petroleum Status Report (weekly U.S. crude and product inventories, refinery utilization, and implied demand, publisher: U.S. Energy Information Administration)
Caveats
Shosho (Lesser Heat) on 7/7 can reweight demand toward power and cooling loads, and shift fuel draws and weather risk inside Utilities and Energy. A decisive turn in the dollar/yield complex or a clear break in the Hormuz talks—and a sharp rollover or re‑acceleration in container rates—would change sector ordering quickly.
Sun Tzu Strategy View
Sun Tzu wrote: —— Do not rely on the enemy not coming; rely on having the means to meet them.
With Hormuz outcomes uncertain, container spot rates elevated, and HBM supply tight, resilience beats prediction. Build buffers—liquidity, alternative routing, energy hedges, and secured component allocations—so shocks land on capacity, not on margins. The winners today are the operators who can absorb delays, reroute freight, and still deliver.
Action: Maintain contingency capacity in logistics and energy; monitor EIA Weekly Petroleum Status and FBX transpacific rates for trigger moves.
Today’s Points
10Y UST at 4.372% and USD/JPY ~162.7 are tightening financial conditions even as Nasdaq sits at 26,214 — keep an eye on July jobs data as the next yield/dollar pivot.
WTI $69.14 and Brent $72.35 trade near recent lows after a fragile US‑Iran negotiating window (60 days); the Strait of Hormuz still handles ~20 million b/d (EIA), so geopolitics remain the key oil risk.
Supply‑chain stress is bifurcated: transpacific container spot rates are >$5,700/FEU (West Coast) and >$8,000/FEU (East Coast) while the Baltic Dry Index is ~2,490 — containerized goods margins and Retail/Consumer Discretionary inventory plans are most at risk.
This is structural analysis through geoeconomics and Nine Star Ki, not investment advice. Verify any actionable read with primary sources and a licensed advisor.
Tiger Capital Researchさん、いいねありがとうございます。読んでいただけてうれしいです。